
Problem Statement
Many genetic syndromes are associated with mild to severe facial dysmorphism. As first suggested in [1], human facial dysmorphisms can be modeled in a lower-dimensional latent space or metric space using metric learning. The associated clusters in the metric space reflect functional relationships among the genes involved. Hence, individuals without a confirmed diagnosis can be placed in the context of modeled phenotypic variation, and thereby in the spectrum of phenotype-genotype relations. Thus, space can be used to propose hypothetical clinical and molecular diagnoses (e.g. by classification from embedding coordinates). This can facilitate subsequent variant interpretation and targeted sequencing as part of a clinical diagnostic workup.
A latent space can be optimized to preserve similarities among observations (e.g., dimensionality reduction using principal components analysis (PCA)), dis- similarities (e.g., metric learning using linear discriminant analysis (LDA)), or both [1,13]. By focusing on similarity measures only, the between-group dissimilarities, which likely optimize the classification, are neglected. Conversely, by solely learning from dissimilarities, the overall similarities among faces are not preserved. In this study, by combining the two aspects, we aim for 1) obtaining optimal classification, and 2) embedding individuals that are phenotypically similar in closer proximity. As such the resulting metric space is expected to be much more intuitively interpretable.
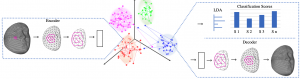
Related work on metric space learning of dysmorphism or syndrome identification based on facial data has mostly focused on 2D images or sparse 3D landmarks or has focused on a limited set of syndromic groups [1,4,5]. Here, we develop a ‘triplet-encoder’ to learn a non-linear low dimensional metric space for syndrome classification from dense 3D meshes of dysmorphic faces [6,11], coupled with spiral convolutional operators allowing us to learn directly from 3D data [2]. We further extend this model by attaching a decoder block to the network to enable facial reconstruction. This forces the metric space to learn facial similarities alongside between-group dissimilarities. In doing so, the resulting metric space not only sup-ports syndrome classification but also provides a comprehensive map of syndromic and general facial variation. We validate the metric space by measuring the performance of a simple linear classifier to assess the degree to which the metric space has learned discriminating variation among the syndromes. Furthermore, we validate properties of the metric space based on clinical knowledge of facial dymsorphisms and their interrelations among the groups. We generate faces at the center of syndrome clusters whereby we and the reader can assess if they display the known facial gestalt of certain disorders. Syndromes that are known to be facially distinctive should in general be distant from controls, whereas those with known overlap with controls should be closer. We assess whether syndromes that are phenotypically distinctive in general, and unique within the dataset, are relatively far from other syndromes and controls. We also assess whether related syndromes are relatively close together and overlap within the metric space.
Results & Discussions
In this work, we learned a metric space that models the range of facial dysmorphism present in 52 syndromes alongside general facial variations. To this end, we proposed a triplet-based auto-encoder (TBAE) to simultaneously learn both facial similarities and group dissimilarities. Classification performance within this metric space is an important measure of its capacity to learn discriminative variation. We compared the performance of our proposed space to a space based on PCA, which is optimized to learn similarities, and one derived from a triplet-based encoder (TBE) which is optimized to learn dissimilarities. We also assessed the model’s ability to learn similarities from the reconstruction errors of the decoder. To position the learned dysmorphic variation in the context of normal range variation (which is necessary for the further validation of the latent space) we embedded the unseen control sample into the latent space and assessed this sample’s reconstruction error to determine if space also represents general facial variation.
Moving beyond simply assessing classification and reconstruction performance, experts categorized the syndromes into three classes of syndromes, of which two include syndromes that are phenotypically distinctive (A and B) and the third class of syndromes that is not necessarily phenotypically distinctive (C). We assessed whether the latent space conforms to expectations based on prior knowledge from clinical genetics by testing if phenotypically distinctive groups are positioned relatively distantly from, and with minimal overlap, to controls. Further, we tested for expected overlap among four RASopathies, an etiologically related group of disorders caused by mutations in genes encoding the RAS/MAPK pathway.
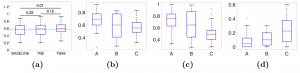
Classification and Reconstruction The average group sensitivities of the models that we trained are shown by boxplots in Fig. 2a. Differences in performance among the models were compared statistically with pairwise comparisons using a paired two-tailed Wilcoxon signed-rank test. The performance of the TBAE is significantly higher than the baseline (pvalue <0.05). The median of the TBE and TBAE is not significantly different, however, the pvalue=0.12 supports suggestive improvement. Also, the lower quartile has improved by TBAE which indicates that learning facial similarity alongside group-dissimilarity by attaching a decoder improves the results for some groups. The average reconstruction error for syndromic and control individuals is shown in Fig. 3a. The average error per vertex is less than 1 mm. Nevertheless, the heat maps indicate that regions around the mouth, nose, and eyes show relatively higher errors. This is more pronounced in syndrome groups compared to the controls. The lips and mouth regions are sensitive to expression variation, introducing extra complexity for the model to learn. The low reconstruction error of control faces shown in Fig. 3a supports the hypothesis that normal facial variation can be presented from the facial variation within the syndrome groups. To assess the visual plausibility and smoothness of the reconstructions from the metric space, some of the reconstructions of the average test set projections are shown in Fig. A.1 in the supplementary material.
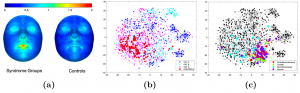
Metric Space Evaluation Fig. 2b compares the distributions of syndrome group sensitivities among syndromes assigned to the phenotypically distinctive categories A and B and the less distinctive category C. Those syndromes in categories A and B have higher median sensitivities than those in category C, with B showing slightly lower sensitivities than A. Fig. 2c and 2d compare the distributions of the proximity and overlap statistics respectively for syndromes within each category. These reflect the proximity and overlap of each syndrome to the controls. In general, as predicted, syndromes in categories A and B are more distant from and overlap less with, controls than those in category C. Graphically, this is shown in the t-SNE visualization (Fig. 3b) which shows syndromes in category A and B are more distant from controls than category C.
Noonan, Costello, Cardiofaciocutaneous syndrome, and Neurofibromatosis Type I (NF1) are members of an etiologically related group of disorders, collectively known as the RASopathies [11]. These syndromes are all caused by the overactivation of the RASMAPK pathway and are known to show considerable phenotypic similarity and overlap. Within the latent space these had a proximity statistic over 97.4%, and an overlap statistic higher than ¿99.9% of random samples of four syndrome groups (the p-values of the hypothesis tests of the closeness and overlap statistics were .036 and <.001 respectively). These results indicate these syndromes are very close together with high overlap in the latent space, as would be expected from their known genetic and phenotypic relationships. The t-SNE plot in Fig. 3c shows these disorders grouped in the lower corner and NF1 is the most dispersed, overlapping considerably with controls. This is also consistent with clinical expectations as NF1 is assigned to category C and is not usually considered to have a distinctive facial phenotype.
The goal of this study was to go beyond classification for aiding in syndrome diagnosis and therefore, to invest in learning a well-structured metric space that can help the study of phenotype-genotype relationships. Future directions include: First, comparing the classification results of our approach with those of Face2gene [4], software often used in clinical workups to assess 2D facial im- ages for syndrome diagnosis. In this context, it is a major challenge to obtain equivalent 2D and 3D datasets for direct comparison. Second, this work might be extended by taking a part-based approach, in which the variation of localized facial segments could be learned both in isolation and in combination. Finally, the adaption of this metric space into clinics will require further validation towards targeted sequencing and genetic variant analysis and classification.
References
- Ferry, Q., Steinberg, J., Webber, C., FitzPatrick, D.R., Ponting, C.P., Zisserman, A., Nell ̊aker, C.: Diagnostically relevant facial gestalt information from ordinary photos. eLife 3, e02020 (Jun 2014). https://doi.org/10.7554/eLife.02020, https: //elifesciences.org/articles/02020
- Gong, S., Chen, L., Bronstein, M., Zafeiriou, S.: SpiralNet++: A Fast and Highly Efficient Mesh Convolution Operator. In: 2019 IEEE/CVF International Con- ference on Computer Vision Workshop (ICCVW). pp. 4141–4148. IEEE, Seoul, Korea (South) (Oct 2019). https://doi.org/10.1109/ICCVW.2019.00509, https: //ieeexplore.ieee.org/document/9021965/
- Gong, S., Chen, L., Bronstein, M., Zafeiriou, S.: SpiralNet++: A Fast and Highly Efficient Mesh Convolution Operator. In: 2019 IEEE/CVF International Con- ference on Computer Vision Workshop (ICCVW). pp. 4141–4148. IEEE, Seoul, Korea (South) (Oct 2019). https://doi.org/10.1109/ICCVW.2019.00509, https: //ieeexplore.ieee.org/document/9021965/
- Gurovich, Y., Hanani, Y., Bar, O., Nadav, G., Fleischer, N., Gelbman, D., Basel- Salmon, L., Krawitz, P.M., Kamphausen, S.B., Zenker, M., Bird, L.M., Gripp, K.W.: Identifying facial phenotypes of genetic disorders using deep learning. Na- ture Medicine 25(1), 60–64 (Jan 2019). https://doi.org/10.1038/s41591-018-0279- 0, https://www.nature.com/articles/s41591-018-0279-0
- Hallgr ́ımsson, B., Aponte, J.D., Katz, D.C., Bannister, J.J., Riccardi, S.L., Maha- suwan, N., McInnes, B.L., Ferrara, T.M., Lipman, D.M., Neves, A.B., Spitzmacher, J.A.J., Larson, J.R., Bellus, G.A., Pham, A.M., Aboujaoude, E., Benke, T.A., Chatfield, K.C., Davis, S.M., Elias, E.R., Enzenauer, R.W., French, B.M., Pick- ler, L.L., Shieh, J.T.C., Slavotinek, A., Harrop, A.R., Innes, A.M., McCandless, S.E., McCourt, E.A., Meeks, N.J.L., Tartaglia, N.R., Tsai, A.C.H., Wyse, J.P.H., Bernstein, J.A., Sanchez-Lara, P.A., Forkert, N.D., Bernier, F.P., Spritz, R.A., Klein, O.D.: Automated syndrome diagnosis by three-dimensional facial imag- ing. Genetics in Medicine (Jun 2020). https://doi.org/10.1038/s41436-020-0845-y, http://www.nature.com/articles/s41436-020-0845-y
- Klein, O., Mio, W., Spritz, R., Hallgrimsson, B.: Developing 3D Cranio- facial Morphometry Data and Tools to Transform Dysmorphology (2019). https://doi.org/10.25550/TJ0, https://www.facebase.org/chaise/record/#1/ isa:dataset/RID=TJ0, version Number: 1 type: dataset
- Maaten, L.v.d., Hinton, G.: Visualizing Data using t-SNE. Journal of Ma- chine Learning Research 9(86), 2579–2605 (2008), http://jmlr.org/papers/v9/ vandermaaten08a.html
- Mahdi, S.S., Nauwelaers, N., Joris, P., Bouritsas, G., Gong, S., Bokhnyak, S., Walsh, S., Shriver, M., Bronstein, M., Claes, P.: 3D Facial Matching by Spiral Convolutional Metric Learning and a Biometric Fusion-Net of Demographic Prop- erties. arXiv:2009.04746 [cs, eess] (Sep 2020), http://arxiv.org/abs/2009.04746, arXiv: 2009.04746
- Schroff, F., Kalenichenko, D., Philbin, J.: FaceNet: A unified embedding for face recognition and clustering. In: 2015 IEEE Conference on Computer Vi- sion and Pattern Recognition (CVPR). pp. 815–823. IEEE, Boston, MA, USA (Jun 2015). https://doi.org/10.1109/CVPR.2015.7298682, http://ieeexplore. ieee.org/document/7298682/
- Skala, V.: Barycentric coordinates computation in homogeneous coordinates. Computers & Graphics 32(1), 120–127 (Feb 2008). https://doi.org/10.1016/j.cag.2007.09.007, https://linkinghub.elsevier.com/retrieve/pii/S009784930700180X
- Tidyman, W.E., Rauen, K.A.: The RASopathies: developmental syndromes of Ras/MAPK pathway dysregulation. Current Opinion in Genetics & Development 19(3), 230–236 (Jun 2009). https://doi.org/10.1016/j.gde.2009.04.001, https:// linkinghub.elsevier.com/retrieve/pii/S0959437X09000707
- White, J.D., Ortega-Castrillo ́n, A., Matthews, H., Zaidi, A.A., Ekrami, O., Sny- ders, J., Fan, Y., Penington, T., Van Dongen, S., Shriver, M.D., Claes, P.: MeshMonk: Open-source large-scale intensive 3D phenotyping. Scientific Reports 9(1), 6085 (Apr 2019). https://doi.org/10.1038/s41598-019-42533-y, https:// www.nature.com/articles/s41598-019-42533-y, number: 1 Publisher: Nature Publishing Group
- Yang, Y., Chen, H., Shao, J.: Triplet Enhanced AutoEncoder: Model-free Dis- criminative Network Embedding. In: Proceedings of the Twenty-Eighth Interna- tional Joint Conference on Artificial Intelligence. pp. 5363–5369. International Joint Conferences on Artificial Intelligence Organization, Macao, China (Aug 2019). https://doi.org/10.24963/ijcai.2019/745, https://www.ijcai.org/proceedings/ 2019/745